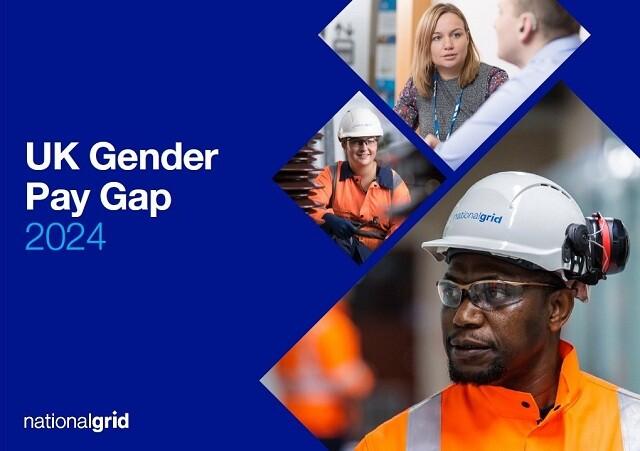
Understanding our UK gender pay gap 2019

Building a diverse workforce and creating an inclusive workplace are vitally important to achieving our purpose, vision and values.  We support the UK Government’s initiative on this important topic.

We have conducted our analysis in line with the gender pay gap regulations which require disclosure of data for all UK legal entities employing more than 250 employees. We also include a Company UK-wide analysis. The separate disclosures for our four UK legal entities (each having more than 250 employees) are provided.

2019 UK-Wide Results

Pay Gap based on 5 April 2019 snapshot

The UK-wide pay gap is 3.7% at the mean and 2.6% at the median.  We have seen decreases in both the mean and median since last year.

Mean*

3.7%

Median**

2.6%

*Mean: a comparison of the average pay for a woman and the average pay for a man. 

**Median: a comparison of the ‘middle’ pay for a woman if all pay amounts were sorted from low to high and the ‘middle’ pay for a man.  The median is less impacted by outlier numbers (very high or very low) than the mean.

The quartile analysis below shows that females, who represent 26% of our total UK population, are under-represented at National Grid and in our industry more generally and both we and our industry need to continue our work to recruit more women. 

Proportion of male and female employees by quartile pay


Male

Female

Upper quartile

78.0%

22.0%

Upper middle quartile

71.4%

28.6%

Lower middle quartile

77.0%

23.0%

Lower quartile

68.0%

32.0%

Overall

73.6%

26.4%

Bonus gap based on 12 months preceding 5 April

The UK-wide bonus gap is -7.2% at the mean and -7.7% at the median.  These figures reflect more women recently hired into senior roles who are now receiving full year bonus and long-term incentive awards.

Mean*

-7.2%

Median**

-7.7%

*Mean: a comparison of the average bonus for a woman and the average bonus for a man. 

**Median: a comparison of the ‘middle’ bonus for a woman if all pay amounts were sorted from low to high and the ‘middle’ bonus for a man.  The median is less impacted by outlier numbers (very high or very low) than the mean.


Proportion of male and female employees receiving bonus pay

Male

Female

92.0%

91.8%

Actions we are undertaking to address the gap

To focus progress on closing our gender pay gap, National Grid has undertaken a number of initiatives to actively recruit into and promote women within our UK business and we are pleased with the progress being made.  For example, within our new talent pipeline we have continued to see a higher proportion of women attracted to our programmes.  In particular, 10.2% of trainee hires in the UK were women and 37.5% of graduate hires were women, materially above the 26.4% of women that comprise our overall UK workforce.

Overall in the UK, women have represented a greater proportion of promotions than in the prior year and we have overseen a year-on-year increase in women in both leadership (Band A-D) roles and in our female Band A-D high potential pool. Women now occupy one-third of senior roles in the UK.

An example of our work with external partners is our participation in the Women’s Engineering Society (WES) which actively campaigns to encourage women to participate and achieve as engineers, scientists and as leaders. We supported WES’ #LottieTour2018 to capture the interest of a younger engineering audience by showing our current engineers ‘touring’ with Lottie Dolls. Women currently make up 11% of the engineering population at UK National Grid.

We continue to be committed to working closely with external partners, such as POWERful women and Energy Leaders Coaltion, to break down barriers and share best practice with the aim of increasing the number of women at senior levels and middle management in the UK’s energy industry.

Last year we introduced global unconscious bias e-learning as part of our work to embed sustainable change in our leadership behaviours regarding inclusion and diversity.

We are pleased with increased external recognition for our gender and ethnicity work; it strengthens our employer brand showing that National Grid is an inclusive organisation where everyone can belong and bring their whole self to work. We’re proud that our work has been recognised externally once again through our inclusion in The Times Top 50 Employers for Women, and that we have been named as a Top 10 Outstanding Employer for race / ethnicity by Business in the Community (BITC).

In 2019 we are continuing to drive progress and impact through our renewed Inclusion & Diversity global strategy and vision “Our workforce will be more representative of the communities we serve in all aspects of diversity.”

To achieve this, we’re making four commitments over the next year across National Grid:

  • We seek to increase the overall proportion of our workforce from diverse backgrounds, in order to mirror the communities we serve. 
  • We will set annual targets to increase the number of hires from diverse backgrounds at a greater proportion than colleagues we have within the overall National Grid workforce today (24% female and 18% ethnic minority)
  • We will set annual targets to increase the number of colleagues promoted who are from a diverse background at a greater proportion than we have today within the National Grid workforce (24% female and 18% ethnic minority)
  • We are committed to building an inclusive company where everybody can achieve their potential.

We’re committed to enabling a diverse workforce and an inclusive culture, and we need the correct diversity data in our systems to help us do this in the right way and ensure we are offering the right support, policies, training and development for all our people.

To encourage colleagues to update their data, as part of our National Inclusion Week celebrations in September, we launched #ThisIsMe – a storytelling campaign that shared open and honest role model stories emphasising to everyone that they can bring their whole selves to work.
 

Gender Pay Gap Statistics by Employing Company

Results by employing company with at least 250 employees are shown below.  Please note that not all of our Gas Transmission and Electricity Transmission employees are employed by NGG Plc and NGET Plc, respectively.  Both of our transmission businesses also have employees from other subsidiaries, particularly NG UK Ltd which has been the employing entity for most of our managerial grade employees since 2006.  Additionally, following the legal separation of our Electricity System Operator business, we have added a fourth employing company to the disclosure.


National Grid Electricity System Operator Ltd gender pay gap statistics

There are 622 employees on a National Grid Electricity System Operator Ltd contract.  We note a more significant gap in this employing entity versus the others due to a particularly small sample of senior leaders employed on this contract, and a higher population of men in highly specialised technical roles which attract a premium over less specialised roles.

Pay gap mean*

12.1%

Pay gap median**

10.1%

Proportion of male and female employees by quartile pay


Male

Female

Upper quartile

79.7%

20.3%

Upper middle quartile

67.2%

32.8%

Lower middle quartile

64.6%

35.4%

Lower quartile

56.2%

43.8%

Overall

69.5%

30.5%

Bonus gap mean*

-9.1%

 Bonus gap median**

7.8%

Proportion of male and female employees receiving bonus pay

Male

Female

95.6%

95.3%

*Mean: a comparison of the average pay for a woman and the average pay for a man. 

**Median: a comparison of the ‘middle’ pay for a woman if all pay amounts were sorted from low to high and the ‘middle’ pay for a man.  The median is less impacted by outlier numbers (very high or very low) than the mean.

National Grid Electricity Transmission gender pay gap statistics:

There are 686 employees on a National Grid Electricity Transmission contract.  The bonus gap data is heavily impacted by a small sample size of senior employees employed on this contract, and also a higher proportion of men in collectively bargained roles with a different pay structure from our personal contract roles.

Pay gap mean*

-3.0%

Pay gap median**

7.7%

Proportion of male and female employees by quartile pay


Male

Female

Upper quartile

93.6%

6.4%

Upper middle quartile

87.8%

12.2%

Lower middle quartile

85.5%

14.5%

Lower quartile

89.1%

10.9%

Overall

89.4%

10.6% 

Bonus gap mean*

-36.9%

 Bonus gap median**

0.1%

Proportion of male and female employees receiving bonus pay

Male

Female

99.7%

97.3%

*Mean: a comparison of the average pay for a woman and the average pay for a man. 

**Median: a comparison of the ‘middle’ pay for a woman if all pay amounts were sorted from low to high and the ‘middle’ pay for a man.  The median is less impacted by outlier numbers (very high or very low) than the mean.

National Grid Gas plc gender pay gap statistics

There are 474 employees on a National Grid Gas plc contract.  There is a higher proportion of females in the lower quartile due to relatively fewer men at the most junior grade employed by this employing company.

Pay gap mean*

4.0%

Pay gap median**

-0.4%

Proportion of male and female employees by quartile pay


Male

Female

Upper quartile

79.7%

20.3%

Upper middle quartile

62.3%

37.7%

Lower middle quartile

82.9%

17.1%

Lower quartile

24.3%

75.7%

Overall

69.2%

30.8%

Bonus gap mean*

-1.6%

 Bonus gap median**

0.4%

Proportion of male and female employees receiving bonus pay

Male

Female

97.9%

99.3%

*Mean: a comparison of the average pay for a woman and the average pay for a man. 

**Median: a comparison of the ‘middle’ pay for a woman if all pay amounts were sorted from low to high and the ‘middle’ pay for a man.  The median is less impacted by outlier numbers (very high or very low) than the mean.

National Grid UK Ltd gender pay gap statistics

There are 4,001 employees on a National Grid UK Ltd contract.

Pay gap mean*

2.6%

Pay gap median**

2.1%

Proportion of male and female employees by quartile pay


Males

Female

Upper quartile

74.1%

25.9%

Upper middle quartile

71.5%

28.5%

Lower middle quartile

76.7%

23.3%

Lower quartile

68.4%

31.6%

Overall

72.5%

27.5%

Bonus gap mean*

5.6%

 Bonus gap median**

-18.8%

Proportion of male and female employees receiving bonus pay

Male

Female

89.3%

90.3%

*Mean: a comparison of the average pay for a woman and the average pay for a man. 

**Median: a comparison of the ‘middle’ pay for a woman if all pay amounts were sorted from low to high and the ‘middle’ pay for a man.  The median is less impacted by outlier numbers (very high or very low) than the mean.


We confirm that the information and data provided is accurate and in line with mandatory requirements. 

Sir Peter Gershon Chairman, National Grid

Peter Gershon's Signature


John Pettigrew Chief Executive, National Grid

John Pettigrew's Signature